
The PAW Report is the largest annual survey of pet wellbeing in the UK and is demographically representative of dog, cat and rabbit owners.
By working with YouGov, our annual PDSA Animal Wellbeing (PAW) Report is representative of the UK pet-owning population by age, region, ethnicity and species of pet owned. This creates an accurate picture of pet wellbeing across the nation.
The first Report was launched in 2011. Now, with 16 years of trend data, the PAW Report investigates how owners are meeting the 5 Welfare Needs of their pets, shares insights from the veterinary profession, and estimates the UK pet dog, cat, and rabbit populations.
Data sources used in the PAW Report:
- Annual nationally representative survey of pet owners
- Surveys of veterinary professionals
- YouGov data on the incidence of pet ownership in the UK (used in the pet population calculations)
- Office of National Statistics (ONS) data (used in the pet population calculations)
Annual survey of pet owners
In conjunction with YouGov, each year we survey a large and demographically representative sample of UK dog, cat, and rabbit owners using YouGov’s panel methodology.
In the latest 2026 Report, the survey sample totalled 3440 cat, dog, and rabbit owners over the age of 18 and living in the UK. Therefore, when talking about ‘owners’ throughout the Report, we’re discussing cat, dog, and rabbit owners, not owners of other types of pets.
The majority of questions required owners to pick one or more options from a list, with the occasional question requiring them to enter a text response.
In 2026, the data was gathered between 25th June 2026-16th July 2026 through an online survey where demographic quotas are set to ensure data gathered is as nationally representative as possible. Any small errors in the final sample are corrected through weighting where necessary. The demographic quotas and weighting that this method uses are determined by a separate YouGov panel survey of 10,000 UK adults which provides demographic information such as regional breakdowns as well as age and gender profiles of owners.
Survey of veterinary professionals
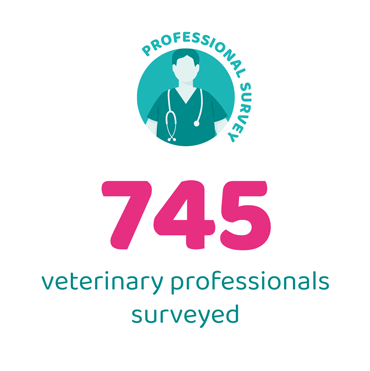
Periodically we survey veterinary professionals online via an open survey. We last repeated this survey in 2023 and collected responses from 745 veterinary surgeons, veterinary nurses, students, nursing support staff, veterinary academics, practice owners, partners and managers.
Fieldwork was undertaken between 6 January and 13 February 2023, hosted by YouGov using an open link. Due to the nature of this survey these figures are not collected in line with any demographic quotas or weighted as per the survey of pet owners. Details of the survey are shared via social media and professional networks to encourage participation. Participants are invited to be entered into a prize draw to win a prize.
Pet population calculation
We work with YouGov to annually calculate estimates of the pet dog, cat and rabbit populations. Three data sources are used in this calculation:
- Separate sampling from the YouGov online survey panel to determine the percentage of UK adults who own each species of pets (n=10,000*)**.
- Data from the PAW Report survey of pet owners on the number of pets owned by each owner**.
- Data from the Office for National Statistics (ONS) on the number of households.
* In 2019, we increased the sample size from n=5,000 to n=10,000. This resulted in a reduction in the size of the range for the estimated number of dogs, cats and rabbits (based on 95% confidence interval) from 2019 onwards.
** Prior to 2014, figures from these two data sources were rounded to whole numbers before being used in the calculation. From 2015 onwards figures rounded to 2 decimal places were used instead to bring greater accuracy to the estimations. The estimated populations for 2011 – 2014 have been recalculated based on figures rounded to two decimal places and are available on the pet dog, cat and rabbit populations webpage.
Data analysis
Data analysis is undertaken using YouGov’s statistical analysis tool, Crunch. Z-tests are used to examine statistical differences in the population. Where differences between figures are communicated (e.g. there is a decrease in the proportion of dog owners who acquired their dog from a rescue or rehoming centre from 22% in 2018 to 17% in 2024) the result is statistically significant at a P-value of 0.05, and the difference between the means is outside the 95% confidence interval. Percentages throughout the Report are rounded to the nearest whole number. Other figures, such as the estimated numbers of pets, are rounded to two significant figures. When calculating these we have taken the total estimated population figure for that species of pet and multiplied it by the percentage taken at two decimal places. The resulting figure is then rounded to two significant figures.
For example, to calculate the estimated number of rabbits not having their companionship needs met:
Estimated pet rabbit population (2024) = 800,000
Percentage of rabbits kept alone or with another species of animal = 50.18%
800,000 x 50.18% = 401,440
The figure is then rounded to two significant figures and presented as: 400,000 rabbits not having their companionship needs met.
These estimated numbers of pets are calculated by PDSA.
Additionally, in 2024, using RStudio (Version 1.2.5033), PDSA employed linear regression modelling (method = "lm") to generate a trend line that best fit the observed data to examine trends over time.
Further information
Further details of the PAW Report methodology can be found in our peer-reviewed paper published in the Veterinary Record. 'Driving evidence-based improvements for the UK's 'Stressed. Lonely. Overweight. Bored. Aggressive. Misunderstood... but loved' companion animals' (Wensley et al, 2021) available via open access